Despite their small size, extracellular vesicles (EVs), such as exosomes, play important roles in normal physiological processes (e.g., immune response, neuronal function, stem cell maintenance) and diseases (e.g., cancer and liver disease). A key bottleneck in EV research is the isolation of the vesicles, which has historically been accomplished via ultracentrifugation. However, ultracentrifugation is time-consuming, is not scalable, requires specialized equipment, may damage vesicles during the high-speed spins, can pull down non-exosomal proteins and nucleic acids, and suffers from low yield. More recently, precipitation solutions have been utilized to simplify EV isolation protocols, but precipitation-based techniques are often inconsistent, provide low yields, and reduce purity. Thus, there is a strong need for a method that rapidly isolates EVs without compromising purity or yield.
We have developed the Capturem Extracellular Vesicle Isolation Kit to solve these challenges. This kit, available in both mini and maxi formats, is comprised of novel membranes conjugated to a lectin-based EV-binding compound to isolate EVs selectively. These membranes have been chemically modified to have increased surface area, which allows higher binding capacity while still providing highly pure and concentrated yields. Additionally, the membranes have been assembled into benchtop centrifuge-compatible spin columns, which can be used to isolate EVs in under 30 minutes (Figure 1). These columns, which are suitable for small (mini) and large (maxi) volumes, can rapidly enrich EVs from biological fluids for downstream proteomic, genomic, and transcriptomic analyses.
Figure 1. Rapid workflow for EV purification with the Capturem EV kit.With the Capturem Extracellular Vesicle Isolation Kit, the supernatant is collected following pre-clearing and filtration steps that remove cellular debris and non-EV proteins, respectively. EVs are then bound to the equilibrated membrane and washed and eluted with appropriate buffers. Each step is followed by spinning the tube in a benchtop centrifuge for just 2 minutes. Workflows for the mini and maxi kits are identical. *Filtration time will vary depending on sample type and volume.
Results
Capturem EV isolation yields pure EVs more consistently than ultracentrifugation, in under 30 minutes
Ultracentrifugation (UC) suffers from several limitations. First, additional debris and larger-sized particles can be pulled down during isolation. Second, fragile EVs can be damaged at high speeds, resulting in decreased yields. Third, removing the supernatant without disturbing the small EV pellet can be technically challenging and difficult to replicate (Jeppesen 2014). In contrast, the Capturem EV isolation kit provides rapid and consistent isolation of pure EVs.
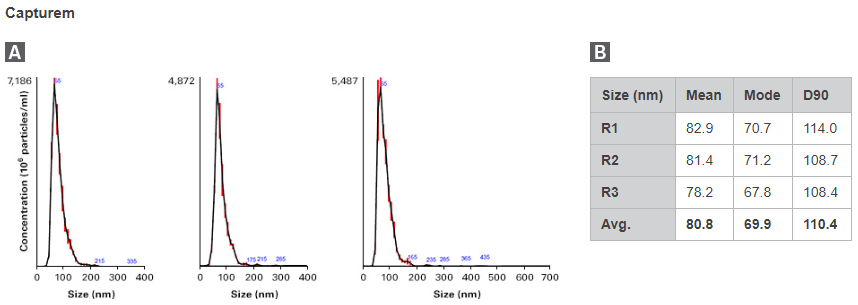
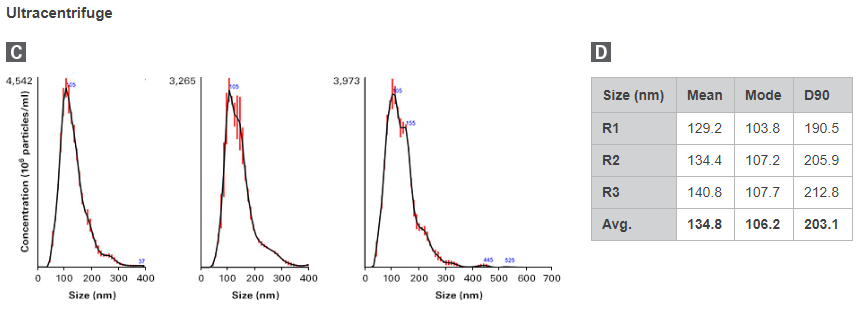
To compare, EVs were isolated from 500 µl of plasma using either the Capturem Extracellular Vesicle Isolation Kit (Mini) or ultracentrifugation, in three replicates. Isolated EVs were subjected to nanoparticle tracking analysis (NTA) for visualization of the size distribution (Figure 2). Capturem-isolated EVs exhibited a narrower, more-enriched yield of exosomes, with an average particle size of 81 nm and a D90 value of 110 nm. Conversely, ultracentrifugation-isolated EVs were larger, with an average particle size of 135 nm and a D90 value of 203 nm. Additionally, the particle sizes isolated from ultracentrifugation were more variable than those from Capturem isolation. These data indicate that Capturem-isolated EVs were a much more distinct and pure population, and within the size ranges commonly associated with EVs.
Figure 2. Comparison of concentration and purity of EVs isolated using the Capturem kit vs. those isolated using ultracentrifugation. NTA was performed on EVs isolated by the Capturem EV isolation kit or ultracentrifugation. Panels A and C. The calculated EV size distribution observed for each method is shown as a mean (black line) with standard error (red lines). Panels B and D. Particle size statistics are shown for EV preparations using the Capturem or ultracentrifuge isolation method, respectively.
This experiment was repeated in triplicate, using two different operators, starting with 500 µl from the same starting plasma source in order to compare particle yield variability. Notably, Capturem-isolated EV yields were highly consistent (2.61 x 10⁹ vs. 2.60 x 10⁹), whereas ultracentrifugation yields were much more variable (4.11 x 10⁹ vs. 1.98 x 10⁹). This variability could lead to significant workflow challenges as well as data interpretation difficulties.
Tests were also run to examine the ability of Capturem technology to isolate EVs from a range of other biofluids, including breast milk, saliva, cerebrospinal fluid (CSF), serum, urine, and cell-conditioned media (CCM) (Figure 3). The Capturem kit was able to isolate EVs from all of these samples, thus demonstrating its usefulness for work with a variety of sample types.
Figure 3. Successful isolation of EVs from different biological fluids using the Capturem EV kit. NTA of EVs isolated from breast milk, saliva, urine, serum, CSF, and CCM with the Capturem EV kit. Calculated size distribution for each preparation is depicted as a mean (black line) with standard error (red lines).
Conventional NTA can sometimes overestimate EV numbers, because broken particles, protein aggregates, or other debris can register as false positives. Using a fluorescent dye that only crosses intact membranes can give more accurate insight into the quality of the isolated sample. Therefore, a final assessment of EV concentration was performed using fluorescent NTA (fNTA). EVs isolated from plasma using the Capturem kit or ultracentrifugation were labeled with the fluorescent dye and subjected to fNTA analysis (Figure 4, Panel A). The results showed that ultracentrifugation-isolated EVs were highly contaminated with non-EV particles, exhibiting only 20% EV fluorescence. In contrast, Capturem-isolated EVs demonstrated more than 4X this enrichment, with over 84% EV fluorescence. fNTA analysis was also performed on EVs isolated from different biofluids (Figure 4, Panel B). EVs isolated using the Capturem kit consistently exhibited significantly higher fluorescence compared to EVs isolated using ultracentrifugation. Thus, Capturem columns consistently provide a pure, intact, and concentrated population of EVs in less than 30 minutes.
Figure 4. Isolation of a purer, more intact population of EVs with Capturem-based isolation compared to ultracentrifugation, as demonstrated by fluorescent NTA. A proprietary fluorescent dye was allowed to react specifically with the surface of intact vesicles, followed by quantification via fluorescent microscopy. Panel A. The graphs show plasma EVs isolated using the Capturem EV isolation kit or ultracentrifugation. Panel B. fNTA analysis of EVs isolated from plasma, serum, saliva, urine, CCM, and milk. The analysis was performed by Alpha Nano Tech.
Morphological characterization of Capturem-isolated EVs by TEM and immunoelectron microscopy
Capturem-isolated EVs from various biofluids were also subjected to TEM and immunoelectron microscopy (Figure 5). Capturem-isolated EVs displayed classical EV morphology and were consistent in size and shape with those isolated using ultracentrifugation. Furthermore, EVs were positive for CD63 surface expression, as visualized by CD63 immunogold labeling. According to these criteria, Capturem-isolated EVs exhibit the correct size, shape, and surface proteins expected in EV morphological analysis.
Figure 5. Morphological analysis of Capturem-isolated EVs displaying classical size, morphology, and CD63 expression on the surface. TEM analysis and immunogold labeling of EVs isolated by the Capturem EV isolation kit or ultracentrifugation. Panel A. Negative staining using uranyl acetate. Representative images of EVs isolated from the same donor for each sample type (labeled on the left of each image set). Panel B. EVs stained with 10 nM of gold-conjugated anti-CD63 antibody followed by uranyl acetate counterstaining. Scale bar: 200 nm. The analysis was performed by Alpha Nano Tech.
Capturem-isolated EVs exhibit classical exosomal protein markers without the presence of any contaminating proteins
EVs can express a variety of protein markers, and a consensus set has yet to emerge. However, it has generally been agreed upon that EVs should contain at least one tetraspanin (CD9, CD63, or CD81), as well as one biogenesis marker (alix). Additionally, isolates should be free of contaminating proteins, such as the endoplasmic reticulum protein calnexin, as well as any sample-dependent contaminating proteins, like albumin from blood samples.
Capturem-isolated EVs and ultracentrifugation-isolated EVs from plasma were analyzed by Western blot using antibodies specific to CD63, CD9, alix, calnexin, and albumin (Figure 6). Tetraspanins were detected in EVs from both isolation methods, but the biogenesis marker alix was not detected in ultracentrifuge-isolated EVs. This suggests that these EVs were less intact or damaged, as the internal protein cargo was not detected. Furthermore, ultracentrifuge-isolated exosomes exhibited high levels of non-EV proteins calnexin and albumin, indicating significant protein contamination in the isolate. Subsequent quantification demonstrated that ultracentrifugation resulted in EVs that had contaminating proteins at a level 21X higher than what was observed in the Capturem isolation, which removes these contaminants during the flowthrough and wash steps. Thus, Capturem isolation of EVs provides a more pure and intact population than ultracentrifugation and does not contain as many contaminating, non-EV proteins.
Figure 6. Evaluation of common tetraspanin and biogenesis markers and contaminating proteins in Capturem-isolated EVs. Western blotting showed that the EV preparation from the Capturem kit contained higher levels of exosome-specific markers CD63, CD9, and alix (positive markers), and lower levels of the non-exosomal protein calnexin and carryover protein albumin (negative markers), as compared to the ultracentrifugation (UC) preparation.
RNA yield from Capturem-isolated EVs is sufficient for downstream RT-qPCR or NGS analysis
Many research and clinical studies rely on the use of nucleic acids in EVs as potential biomarkers to study and track disease. These biomarkers are typically studied and quantified using qPCR or NGS techniques. Thus, EV isolates must provide sufficient nucleic acid starting material for subsequent analyses.
miRNA was isolated from Capturem- and ultracentrifugation-isolated EVs using NucleoSpin miRNA Plasma and quantified using a Bioanalyzer to generate the RNA profile (Figure 7). Notably, RNA yield was ~100 pg/µl when using Capturem-isolated EVs from 50 µl of plasma, while 300 µl of plasma was required to obtain a comparable yield from ultracentrifugation. RNA yield was similar for Capturem-isolated EVs from other biofluids (Figure 7, Panel C).
Figure 7. High and consistent RNA content in EVs isolated by the Capturem EV isolation kit. Representative Bioanalyzer profiles of RNA isolated from the same donor. Panel A. The Capturem EV miniprep was performed with just 50 µl of plasma and yielded ~100 pg/µl of RNA. In contrast, ultracentrifugation was performed with 300 µl of plasma for a similar EV yield (Panel B).Panel C. EVs were isolated from larger sample volumes using the Capturem EV maxi kit and gave consistent RNA yields. The peaks at 25 nt are internal standards.
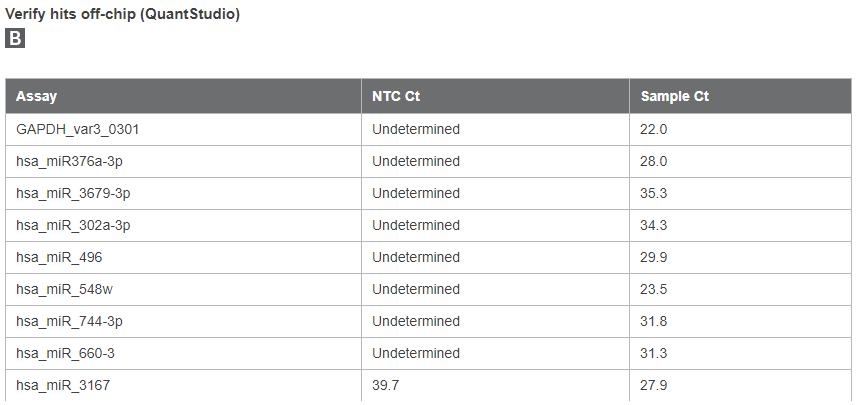
Next, isolated RNA from Capturem-isolated EVs was screened for miRNAs (Figure 8). RNA was first reverse-transcribed to cDNA using the SMARTer smRNA-Seq Kit for Illumina and then preamplified using Prelude PreAmp Master Mix. The resulting cDNA pool was assayed for miRNA using a 1,200 miRNA target screen on the SmartChip Real-Time PCR System. 108 miRNAs were detected, and the top eight hits were verified off-chip. miR-548w, miR-496, miR-744-3p, miR-660-3, miR-3167, and miR-376A-3p had the highest copy numbers in the isolated samples, and many have been previously identified to be enriched in plasma-isolated EVs. This analysis shows that Capturem-isolated EVs contain sufficient RNA yield for downstream RT-qPCR.
Amplification curves from SmartChip RT-qPCR
Figure 8. SmartChip RT-qPCR miRNA analysis of RNA purified from Capturem-isolated EVs. Panel A. RNA isolated from EVs using the Capturem isolation kit was reverse transcribed, preamplified, and then analyzed using the SmartChip Real-Time PCR System. The amplification curve (bottom left) and melting curve (bottom right) for MIR-376A are shown. Panel B. 101 of 285 assays with a Ct <28 had clean no-template controls (NTCs) on the NTC chip. The top eight assays were also tested off-chip along with GAPDH.
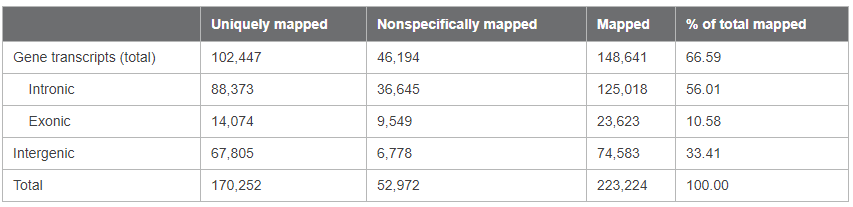
Finally, we created an NGS library from Capturem-isolated EVs using the SMARTer Stranded Total RNA-Seq Kit v2 - Pico Input Mammalian. A Bioanalyzer trace demonstrated a good, uniform library was created, and subsequent sequencing demonstrated good gene coverage (Figure 9). Two transcripts with the highest number of reads were ACACB and CUL9, both of which have previously been published to be present in EVs. Thus, NGS libraries can be created and sequenced using Capturem-isolated EVs.
Figure 9. Profiling the transcriptome of Capturem-isolated EVs by NGS. RNA extracted from Capturem-isolated EVs was used as input for stranded NGS analysis. Panel A. Bioanalyzer trace showing the profile for the cDNA output from the NGS library preparation kit. Panel B. Sequencing alignment metrics from Illumina NGS, using the cDNA in Panel A as input. 0.1% of reads were from rRNA, and 0.0% of reads were from mitochondrial RNA.
Conclusions
Research and clinical studies could greatly benefit from technology that provides rapid and simple isolation of EVs from various biofluids—especially as it concerns methods that generate pure, concentrated EV samples with enough yield for subsequent proteomic, genomic, and transcriptomic analyses. We have designed the Capturem Extracellular Vesicle Isolation Kit to meet these high standards, enabling researchers to obtain pure, concentrated EVs consistently. Furthermore, using either the mini format for small volumes or the maxi for larger (>1-ml) volumes, we have demonstrated that the RNA yield from these EVs is sufficient for downstream RT-qPCR and NGS analyses. These tools can be used for rapid analysis of samples for clinical research and can enable greater discovery and diagnostic potential for a variety of diseases.
Methods
EV isolation
EVs were isolated from the same sample for each type of biofluid using ultracentrifugation and the Capturem EV kit. Isolation of EVs using the Capturem Extracellular Vesicle Isolation Kit (Mini) or (Maxi) was performed as per the user manuals. For ultracentrifugation, pre-cleared biofluid supernatant was centrifuged at 100,000g for 1.5 hr at 4°C using an Optima MAX-E Ultracentrifuge (Beckman Coulter) to collect EVs. The EV pellet was then washed in PBS and further ultracentrifuged at 100,000g for 1.5 hr at 4°C. The final EV pellet was resuspended in 1 ml of PBS and stored at –80°C.
Analysis
For reliable NTA measurement, we used an appropriate EV sample dilution that yields approximately 20–100 particles in the field view. Optimized video capture setting parameters were used with a screen gain set to 2 or 3 and camera level set to 14 or 15. The chosen tracking settings were a screen gain between 8–10 and a detection threshold of 2 or 3. Three 30-second videos were recorded on the Malvern Panalytical NanoSight LM10 and then analyzed using tracking software.
For Western blotting, each lane was loaded with 5 µg of total protein, as measured using the Pierce BCA Protein Assay Kit (Thermo Fisher Scientific). For TEM analysis, negative staining was performed with uranyl acetate, and representative images were taken of preparations from each method. For immunoelectron microscopy, EVs were stained with 10 nM of gold-conjugated anti-CD63 antibody, followed by uranyl acetate counterstaining. The analysis was performed by Alpha Nano Tech.
RNA was extracted from isolated EVs using the NucleoSpin miRNA Plasma kit and analyzed with the RNA 6000 Pico Kit (Agilent). Bioanalyzer profiles were generated for RNA extracted from EVs isolated either from 50 µl of plasma input for the Capturem EV kit or 300 µl of plasma input for ultracentrifugation.
Jeppesen, D. K., et al. Comparative analysis of discrete exosome fractions obtained by differential centrifugation. J. Extracell. Vesicles 3, 25011 (2014).
Let us deliver the latest news to you
We have created a low-volume (not-spammy) newsletter so that you can easily keep up with what's going on in the industry.