Overview
- Developing effective immune cell therapies requires the establishment of activation methods that can be used to efficiently engineer cells while maximizing the viability and potency of cell products
- GoStix Plus assays enable 10-minute quantitation of human IL-2, TNF-α, and IFN-γ from cell culture supernatant, providing a quicker and simpler alternative to existing cytokine analysis methods
- Analysis of T-cell populations activated by three different methods confirms that GoStix Plus assays yield results comparable to ELISAs, allowing for rapid assessment of cytokine profiles under varying culture conditions
Introduction
Basic research on the activation of T cells has helped to elucidate associated biological phenomena such as the initiation of immune responses, thymocyte development, T-cell exhaustion, cellular signaling, and memory cell formation. This growing body of knowledge—applied to the development of adoptive cell therapies that harness bioactive T cells as treatments for various malignancies and infections—has driven significant advances in methods for ex vivo growth and manipulation of T cells.
Among a variety of different immune cell therapies that have shown promise, chimeric antigen receptor (CAR) T cells have provided durable responses for certain cancers (Reddy et al. 2020), such that several CAR-T therapies have gained regulatory approval, and many more are currently in preclinical and clinical stages of development. CAR-T cells are typically generated via genomic integration of a construct encoding an MHC-independent CAR specific for a tumor-associated antigen (Figure 1). CAR constructs are usually transduced into ex vivo patient or donor-derived T cells using recombinant retroviral or lentiviral vectors.

Figure 1. Normal T cell vs. CAR-T cell. Normal, unmodified T cells employ T-cell receptors (TCRs) to recognize and respond to MHC-presented antigens on the surface of neighboring target cells (e.g., tumor cells). In contrast, CAR-T cells are genetically modified to express chimeric antigen receptors (CARs), which typically employ single-chain variable fragment (scFv) domains to recognize antigens localized at the cell surface, in an MHC-independent manner.
Efficient modification of T cells by viral vectors is dependent upon a variety of factors, including the activation status of the cells at the time of transduction and the quality of the viral vectors used (Prommersberger et al. 2020). Activation status can affect T-cell growth and expansion, expression of the engineered receptor, and duration of anti-tumor responses.
Many different strategies have been developed to activate T cells, ranging from the use of nonspecific reagents such as the mitogen Phytohemagglutinin (PHA), to receptor-targeted methods using anti-CD3 or anti-CD28 monoclonal antibodies. PHA is a lectin that nonspecifically binds to the sugars on glycosylated T-cell receptors (TCRs), resulting in a low-level stimulation required for IL-2 expression (Chen et al. 2013). Antibodies against CD3 provide a strong proliferative signal via the TCR complex (signal 1), whereas anti-CD28, when delivered in tandem, provides additional costimulatory signals (signal 2) that further enhance the proliferative response. Accordingly, anti-CD3/CD28-coated magnetic beads and antibody tetramers have become widely used reagents for T-cell activation and expansion protocols.
A common experimental objective in the development of approaches for T-cell activation involves profiling different T-cell subtypes to assess the impacts of various activation methods and to evaluate the degree of T-cell responses. These analyses are typically performed via measurement of secreted cytokines using immunodetection methods such as ELISAs and bead or glass arrays, however, these can be cost-, time-, and/or labor-intensive approaches (Figure 2). Here we introduce GoStix Plus assays for cytokine analysis, which employ a lateral flow-based method that allows for reliable quantitation of human IL-2, IFN-γ, and TNF-α in approximately 10 minutes.

Figure 2. Timelines associated with commonly used methods for measuring cytokines. GoStix Plus: a lateral flow-based quantitation method. Fast ELISA: measurement using targeted, preformulated ELISA reagents. Standard ELISA: measurement using standard direct or indirect sandwich assay. Bead array: multiparametric measurement by flow cytometry of bead-based immunocapture of cytokines. Glass array: multianalyte measurement using quantitative, glass-slide multiplex ELISA microarray platform. Assay durations were taken from manufacturers’ protocols.
To demonstrate the utility of GoStix Plus assays for rapid quantitation of cytokines in immune cell culture applications, primary human T cells were isolated from peripheral blood mononuclear cells (PBMCs) and activated using either of three different methods. Cell culture supernatants were harvested at regular intervals and analyzed for levels of IL-2, IFN-γ, and TNF-α using both GoStix Plus and ELISAs from a leading manufacturer. Results indicated that differing cytokine profiles associated with the respective activation methods could be reliably characterized using both methods.
Materials and methods
T-cell activation
Human primary T cells were isolated from PBMCs using negative selection, cultured in RPMI + 10% FCS and then activated using either anti-CD3/CD28 coated beads (Miltenyi Biotec) or anti-CD3/CD28 tetramer complexes (STEMCELL Technologies) following each manufacturer’s protocol, or with PHA at a concentration of 10 µg/ml. Cell cultures were imaged at successive timepoints and samples were taken for quantitation of human Th1 cytokines.
Cytokine measurement
Human IL-2, IFN-γ, and TNF-α levels were analyzed using corresponding ELISAs (R&D Systems) according to the manufacturer’s instructions, and using GoStix Plus.
Each two-step GoStix Plus assay consists of adding a small amount of culture supernatant or diluted serum to a lateral flow cassette, allowing 10 min for the development of test and control bands, followed by imaging and analysis of the results using a smartphone running the GoStix Plus app (Figure 3). The app performs densitometric analysis of the test and control bands and then consults a lot-specific standard curve (automatically downloaded to the app) to quantify the amount of cytokine present.
Figure 3. Cytokine GoStix Plus workflow. Apply 20 µl of sample to a GoStix lateral flow cassette followed by 80 µl of chase buffer. Wait 10 minutes for the test to run, and then scan the cassette using the GoStix Plus smartphone app.
Results
Morphological outcomes
Sequential imaging of the respective T-cell cultures revealed varying activation profiles for the corresponding methods (Figure 4). Whereas bead-based activation was associated with a more rapid onset of cell proliferation (as soon as 4 hours post-activation) and more pronounced cell aggregation at later timepoints, PHA- and tetramer-based activation resulted in a more gradual ramping up of proliferation and lesser degrees of aggregation. Aggregation is commonly observed in activated T-cell cultures (Hommel et al. 2003) and has been attributed to ligand-receptor interactions (e.g., LFA-1/ICAM-1) that promote T-cell activation by facilitating intercellular signaling (Grakoui et al. 1999).
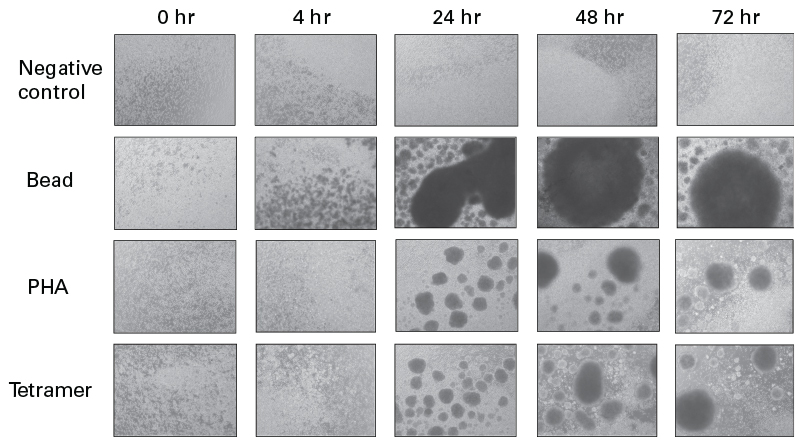
Figure 4. Sequential imaging of T-cell cultures activated using three different methods. Human primary T cells were activated with either CD3/CD28-coated beads, PHA, or CD3/CD28 tetramer complexes following manufacturers’ protocols and imaged at the indicated timepoints to demonstrate morphological differences between the cultures.
Cytokine profiles
Analysis of cell culture supernatants harvested at the indicated timepoints revealed divergent cytokine profiles for each activation method, differences which were consistently observed using both ELISA and GoStix Plus. Interestingly, whereas PHA- and tetramer-based activation appeared to yield similar outcomes in the morphological analysis, IFN-γ, IL-2, and TNF-α were barely detected (if at all) in the PHA-activated culture at any of the included timepoints using either assay method (Figure 5 and data not shown). Consistent with the imaging data, bead-based activation was associated with more rapid accumulation of IFN-γ and TNF-α as compared to activation using tetramers (Figures 5 and 6).

Figure 5. Quantitation of IFN-γ by ELISA and GoStix Plus. Human primary T cells were activated with either CD3/CD28-coated beads, PHA, or CD3/CD28 tetramer complexes following manufacturers’ protocols. IFN-γ levels in cell culture supernatants harvested at the indicated timepoints were analyzed using both IFN-γ GoStix Plus and ELISA. Assay results were converted into IU/ml values using NIBSC reference standard 82/587.
Figure 6. Quantitation of TNF-α by ELISA and GoStix Plus. Human primary T cells were activated with either CD3/CD28-coated beads or CD3/CD28 tetramer complexes following manufacturers’ protocols. TNF-α levels in cell culture supernatants harvested at the indicated timepoints were analyzed using both TNF-α GoStix Plus and ELISA.
In contrast with the results obtained for IFN-γ and TNF-α, which showed steady accumulation of the respective cytokines over time following activation with either beads or tetramers, IL-2 profiles differed somewhat between the two activation methods (Figure 7). With bead-based activation, IL-2 levels peaked at 24 hours and then declined over subsequent timepoints, whereas with tetramer-based activation, IL-2 levels increased markedly between the 24- and 48-hour timepoints, appearing to plateau somewhat at the 72-hour timepoint. The declining IL-2 levels observed in the bead-activated culture may have resulted from diminished IL-2 production and/or more rapid uptake of IL-2 by activated T cells. Additional studies are needed to distinguish between these possibilities.

Figure 7. Quantitation of IL-2 by ELISA and GoStix Plus. Human primary T cells were activated with either CD3/CD28-coated beads or CD3/CD28 tetramer complexes following manufacturers’ protocols. IL-2 levels in cell culture supernatants harvested at the indicated timepoints were analyzed using both IL-2 GoStix Plus and ELISA.
Conclusions
Comparison of three different T-cell activation methods demonstrated varying outcomes in terms of cell proliferation and aggregation, and production of IFN-γ, TNF-α, and IL-2 cytokines:
- Anti-CD3/CD28-coated beads provided a stronger activation than the other methods, resulting in a more immediate and pronounced increase in T-cell proliferation, a greater degree of cell aggregation, and higher levels of IFN-γ and TNF-α production as compared to PHA- and anti-CD3/CD28 tetramer-based methods
- While PHA and tetramer complexes appeared to yield similar proliferation and aggregation responses, the former method did not result in measurable production of any of the three cytokines assayed over the 3-day span of the analysis; by contrast, IFN-γ, TNF-α, and IL-2 were each detected by both ELISA and GoStix Plus at 24 hours and subsequent timepoints in the tetramer-activated culture
- Bead-based activation was associated with declining IL-2 levels at the 48- and 72-hour timepoints, in contrast with stable or increasing IL-2 levels observed in the tetramer-activated culture
Characterizing the dynamics of T-cell activation, including proliferative responses and cytokine profiles, is an important objective in the development of cell processing workflows because it provides a basis for optimizing the timing of downstream steps such as transduction and expansion of the activated T cells, and determination of T-cell subsets.
In the analysis presented above, 10-minute IFN-γ, TNF-α, and IL-2 GoStix Plus assays yielded cytokine profiles comparable to results obtained using corresponding ELISAs, revealing the same differences between the respective T-cell activation methods but in a fraction of the time. By providing a faster, simpler alternative to conventional ELISAs, GoStix Plus assays enable researchers to conserve resources by determining the statuses of their cultures in real time and selecting only those that are suitable for further characterization and analysis by more costly and lengthy methods (e.g., functional assays, cytometric bead arrays). In addition, because GoStix Plus assays are performed in a single-test format, there is no incentive to wait to accumulate a given quantity of samples for parallel processing as there is with multiwell ELISAs, so researchers are free to analyze their samples as they obtain them, thereby accelerating the pace of their studies.
References
Chen, L. & Flies, D. Molecular mechanisms of T cell co-stimulation and co-inhibition. Nat. Rev. Immunol. 13, 227–242 (2013).
Grakoui, A. et al. The immunological synapse: a molecular machine controlling T cell activation. Science 285, 221–227 (1999).
Hommel, M. & Kyewski, B. Dynamic changes during the immune response in T cell-antigen-presenting cell clusters isolated from lymph nodes. J. Exp. Med. 197, 269–280 (2003).
Prommersberger, S., Hudecek, M. & Nerreter, T. Antibody‐based CAR T cells produced by lentiviral transduction. Curr. Protoc. Immunol. 128, e93 (2020).
Reddy, O., Stroncek, D. & Panch, S. Improving CAR T cell therapy by optimizing critical quality attributes. Semin. Hemat. 57, 33–38 (2020)