Overview
- 5′ RACE approach captures complete V(D)J variable regions of BCR transcripts
- Sensitive and reproducible clonotype detection from a wide range of RNA input amounts
- Accurate view of biological variation in human BCR repertoires, without amplification biases
- UMI-based correction removes reads derived from PCR error or duplication, providing more accurate results
Introduction
B cells are essential parts of the adaptive immune response, expressing B-cell receptors (BCRs) on their surface, thus enabling the recognition of unique molecular patterns in pathogens. Understanding the profiles of BCRs (i.e., the diversity of receptors and clonotypes) can not only aid in gaining insights into the adaptive immune response in healthy individuals but also in those with a wide range of diseases. Accurate determination of the clonotypes and isotypes expressed by the immune system will aid in a complete picture of the B-cell repertoire.
Current next generation sequencing (NGS) approaches for profiling B-cell repertoires yield valuable insights into the adaptive immune response and antibody engineering. There are two major approaches used in profiling B-cell repertoires: multiplex PCR and 5′ RACE combined with NGS. While multiplexing allows you to amplify multiple BCR genes in one reaction, it may prove challenging with regard to sensitivity, specificity, and biases in amplification of certain sequences, all of which can lead to difficulties in accurate and reproducible identification of isotypes.
The new SMARTer Human BCR IgG IgM H/K/L Profiling Kit leverages SMART technology (Switching Mechanism at 5′ End of RNA Template) and pairs NGS with a 5′ RACE approach in order to provide a sensitive, accurate, and optimized approach to BCR profiling (Figure 1A). Contrary to systems that use multiplex PCR, the 5′-RACE method does not require any prior knowledge of the sequences comprising the 5′ end of BCR transcripts. The 5′-RACE method reduces variability and allows for priming from the constant region of IgG and IgM heavy or light chains (Figure 1B). The benefits of 5′ RACE with gene-specific amplification come together in this highly sensitive and reproducible method for profiling B-cell repertoires, and allow you to capture complete V(D)J variable regions of BCR transcripts. Downstream sequencing allows for accurate identification of top clonotypes and reliable assignment of isotype in a majority of cases.
This new profiling kit also includes unique molecular identifiers (UMI). The BCR UMI Oligo contains 12 random nucleotides, which are incorporated into the cDNA during the template-switching step. When used with our Takara Bio Immune Profiler Software, PCR duplicates and errors can be detected and removed for more accurate and reliable clonotype calling and quantification.
Figure 1. SMARTer Human BCR IgG IgM H/K/L Profiling Kit workflow. Panel A. First-strand cDNA synthesis is dT-primed and performed by the MMLV-derived SMARTScribe Reverse Transcriptase (RT), which adds nontemplated nucleotides upon reaching the 5′ end of each mRNA template. The SMART UMI Oligo anneals to these nontemplated nucleotides and serves as a template for the incorporation of an additional sequence of nucleotides into the first-strand cDNA by the RT (this is the template-switching step). The first strand cDNA is then subjected to two rounds of gene-specific PCR amplification (see details in panel B). The nested PCR in the second round ensures that the vast majority of the reads map to B-cell receptor transcripts. Panel B. The first PCR uses the first-strand cDNA as a template and includes a forward primer with complementarity to the Illumina Read Primer 2 sequence (PCR1 Universal Forward primer), and a reverse primer that is complementary to the constant region of BCR heavy or light chains (PCR1 IgG/IgM/IgK/IgL Reverse primers). By priming from the Read Primer 2 sequence and the constant region, the first PCR specifically amplifies the entire variable region and a considerable portion of the constant region of BCR heavy or light chain cDNA. The second PCR takes the product from the first PCR as a template and uses semi-nested primers (PCR2 IgG/IgM/IgK/IgL Reverse primers) to amplify the entire variable region and a portion of the constant region of BCR heavy or light chain cDNA.
Results
Sensitive and reproducible clonotype detection from a wide range of RNA amounts
To evaluate the sensitivity of the new SMARTer Human BCR IgG IgM H/K/L Profiling Kit, libraries were prepared from 1 ng, 10 ng, and 100 ng of human CD19+ B-cell total RNA. As shown in Figure 2, clonotype counts from IgG, IgM, IgK, and IgL sequences consistently increase as the RNA input amount increases. Similar data were obtained when using RNA extracted from PBMCs with inputs ranging from 10 ng to 1 μg. These data clearly indicate that the kit is robust enough to accommodate samples with very little input and/or very high complexity.
Figure 2. Clonotype calls identified from 1–100 ng B-cell RNA. BCR profiling IgG, IgM, IgK, and IgL libraries were generated from 1 ng, 10 ng, and 100 ng of human CD19+ B-cell total RNA. For analysis, libraries were downsampled to 100,000 reads, 400,000 reads, and 5,000,000 reads for RNA inputs of 1 ng, 10 ng, and 100 ng, respectively, then processed by the Takara Bio Immune Profiler Software.
In addition to high sensitivity and the ability to accommodate a large range of sample complexity, this protocol also shows high reproducibility. Indeed, when technical replicates were performed with 1 μg of PBMC RNA extracted from a single donor, the correlation between overlapping clones was excellent, with a Pearson correlation of 0.98 and Spearman correlation of 0.72 (Figure 3).
Figure 3. Scatterplot showing reproducibility between libraries generated with 1 μg of PBMC RNA. Libraries were prepared in duplicate for IgG, IgM, IgK, and IgL starting from 1 μg of PBMC RNA from a healthy donor. For analysis, libraries were downsampled to 13 million reads. Plot includes all four libraries (IgG, IgM, IgK, and IgL) from technical replicates.
Confident identification of low-abundance clonotypes
In order to further test the reproducibility and limit of detection of the kit, we spiked a serial dilution of RNA extracted from four B-cell-derived carcinoma cell lines into 100 ng of PBMC RNA. As shown in Figure 4, we were able to detect all four cell lines at spike-in levels as low as 1 pg. The quantities of the four cell lines at different spike-in levels detected in the 100-ng background of the PBMC RNA profile are perfectly matched to the expected ratios. These results further demonstrate the high sensitivity and robustness of the assay.
Figure 4. Successful identification of low-abundance clones. 1 ng, 100 pg, 10 pg, and 1 pg of each of the four cell lines (Raji, TIB190, TIB196, and CRL2974) were spiked into 100 ng of a single donor’s PBMC RNA. The plot above shows calculated correlations between spike-in RNA proportions (Log10) and detected frequencies (Log10) for each cell line.
Significant impact of biological variation on the number of clonotypes detected
The number and status of B cells in peripheral blood circulation vary from person to person. We tested 10 ng of PBMC RNA from eight different donors with our new profiling kit. A total of 32 libraries from these eight donors (all four chains for each sample) were pooled and sequenced. We found that clonotype counts were indeed very different from sample to sample, as shown in Figure 5. These data also demonstrated the large range of clonotype counts that the kit can accommodate—the smallest clonotype count identified in one library was 53, while the largest was around 4,200. The on-target rates of these libraries ranged from 75% to 95%, and 19 out of the 32 libraries had on-target rates over 85% (data not shown). Different types of biological samples were also tested and the recommended input ranges and expected outcomes are summarized in Table I.
Figure 5. Clonotype counts from PBMC RNA obtained from different donors. IgG, IgM, IgK, and IgL clonotypes from 10 ng each of PBMC RNA from eight donors (represented by different colors) were determined using the SMARTer Human BCR IgG IgM H/K/L Profiling Kit. Libraries were normalized to 100,000 reads for analysis.
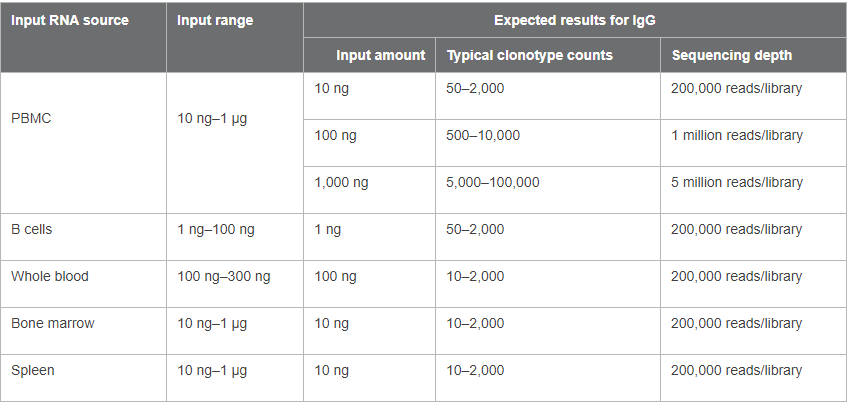
Table I. Recommended RNA input ranges for different biological samples and expected results.
Avoid oversequencing with UMI analysis
The incorporation of unique molecular identifiers (UMIs) is another great feature of the new human BCR profiling kit. UMIs are often used to remove molecular duplicates and sequencing errors resulting from PCR. As shown in Figure 6A, without UMI-based correction, the number of clonotype counts continuously increased with an increase in sequencing depth (purple line), but was likely due to the accumulation of PCR and sequencing errors. However, when UMI-based correction was included, the increase in clonotype counts reached a plateau phase after reaching a sequencing depth of 100K reads per library. Not only did the analyses with 100K and 1,500K reads have similar numbers of clonotype counts, but their clones also largely overlapped, as shown in Figure 6B. Collectively, these results suggest that for SMARTer human BCR libraries generated from 10 ng PBMC RNA, 100K reads per library is sufficient to capture the majority of clones.
Figure 6. Evaluation of sequencing saturation for 10-ng PBMC RNA libraries. BCR profiling libraries from 10 ng of PBMC RNA from a single donor were prepared using the SMARTer Human BCR IgG IgM H/K/L Kit. Panel A. IgG clonotype counts at different sequencing depths are shown with (blue line) and without (purple line) UMI-based error correction. IgG and other chains (IgM, IgK, and IgL not shown) were sequenced at 1.5 million reads per library, then were downsampled to 1 million, 500K, 200K, 100K, 50K, 10K, and 5K reads. All analyses at different sequencing depths were generated with our Takara Bio Immune Profiler Software. Panel B. Venn diagrams showing overlapped clonotypes between libraries with low (100K) and high (1,500K) sequencing depths.
Conclusions
The SMARTer Human BCR IgG IgM H/K/L Profiling Kit is a powerful tool for profiling human B-cell receptors. By leveraging SMART technology and combining a 5′ RACE approach with gene-specific amplification, this workflow captures complete V(D)J variable regions of BCRs and is optimized for highly sensitive and specific clonotype detection. With primers that incorporate Illumina-specific adapter sequences during cDNA amplification, the protocol generates indexed libraries, ready for sequencing on Illumina platforms. This optimized method also includes a unique PCR cycling and pooling workflow which reduces sequencing costs while still enabling accurate clonotype identification. By avoiding multiplex PCR, this kit also avoids the pitfalls of amplification biases of certain sequences, helping to provide a complete and accurate view of human BCR repertoires. Incorporating UMIs into the libraries makes it possible to remove reads derived from PCR errors or duplication and/or sequencing errors, thus ensuring more accurate and reliable results.
Methods
CD19+ B-cell RNA was purchased from Miltenyi Biotech (Cat. # 130-093-169). PBMC RNA from single donors was purchased from Biochain (Cat. # R1234148-10) in addition to in-house RNA which was extracted from PBMC cells acquired from AllCells. RNA was extracted using the Macherey-Nagel NucleoSpin RNA Kit. B-cell carcinoma cell lines Raji, TIB190, TIB196, and CRL2974 were purchased from ATCC and cultured as they suggested. RNA from each cell line was then extracted using the same Macherey-Nagel NucleoSpin RNA Kit as above. 1 ng, 100 pg, 10 pg, and 1 pg each of RNA from the four cell lines (Raji, TIB190, TIB196, CRL2974) were spiked into 100 ng of a single donor’s PBMC RNA.
All libraries containing IgG and IgM heavy and light chain sequences were generated using the SMARTer Human BCR IgG IgM H/K/L Profiling Kit, as per the main protocol in the user manual (without the multiplexing option in Appendix A). Libraries were produced using first-strand cDNA as a template in three different PCRs for heavy chain and kappa and lambda light chains. The products of these PCRs were used as templates in a set of nested PCRs, one for each chain. Following purification and size selection, libraries were validated using the Agilent 2100 Bioanalyzer. All libraries were sequenced on an Illumina MiSeq platform with 600-cycle V3 cartridges (Cat. # MS-102-3003).
Sequencing data analysis was completed by the Takara Bio Immune Profiler Software, which features MIGEC (Shugay, 2014) and MiXCR (Bolotin, 2015) software.
References
Shugay M. et al. Towards error-free profiling of immune repertoires. Nat. Methods 11, 653–655 (2014).
Bolotin, D.A. et al. MiXCR: software for comprehensive adaptive immunity profiling. Nat. Methods 12, 380–381 (2015).